Recently doing a performance upgrade for the Newbe.Claptrap , introduce the basic usage of the dotTrace software used in the process to the developers.
Summary
dotTrace is Jetbrains' profile software for .net applications.Helps with diagnostic analysis of time-consuming functions and memory problems in your software.
In this article, we will use Jetbrains' dotTrace software to analyze some known performance issues.This enables the reader to master the basic skills of using the software.
During the process, we will be paired with some classic interview questions to demonstrate the use of the software step by step.
This example uses Rider as the IDE for the main demonstration. Developers can also do the same with VS and Resharper.
How to get dotTrace
dotTrace is paid software.Currently, the software directly as long as dotUltimate and above licenses are purchased.
Of course, the software also includes a trial version, which allows you to start the 7-day trial for free.Jetbrains' IDE purchases are more than a year old to get the latest version of the current permanent use.
Or you can buy Jetbrains family bucket license, all at once.
Classic scene reproduction
Next, let's take a look at how to use dotTrace through some classic interview questions.
When to use StringBuilder
What a classic interview question.Friends who can see this article, I'm sure you all know that StringBuilder can reduce string direct stitching fragmentation and memory stress.
Are we real?Will it just the interviewer who wants to embarrass me and bully me with asymmetric information?
It doesn't matter, next, let's use dotTrace to analyze a wave of specific combination code.See if using StringBuilder has reduced the pressure on memory allocation.
First, let's create a unit test project and add one of the following test classes:
using System.Linq;
using System.Text;
using NUnit.Framework;

namespace Newbe.DotTrace.Tests
{
    public class X01StringBuilderTest
    {
        [Test]
        public void UsingString()
        {
            var source = Enumerable.Range(0, 10)
                . Select(x => x.ToString())
                . ToArray();
            var re = string. Empty;
            for (int i = 0; i < 10_000; i++)
            {
                re += source[i % 10];
            }
        }

        [Test]
        public void UsingStringBuilder()
        {
            var source = Enumerable.Range(0, 10)
                . Select(x => x.ToString())
                . ToArray();
            var sb = new StringBuilder();
            for (var i = 0; i < 10_000; i++)
            {
                sb. Append(source[i % 10]);
            }

            var _ = sb. ToString();
        }
    }
}
Then, as shown in the following image, we set the profile pattern in Rider to Timeline.
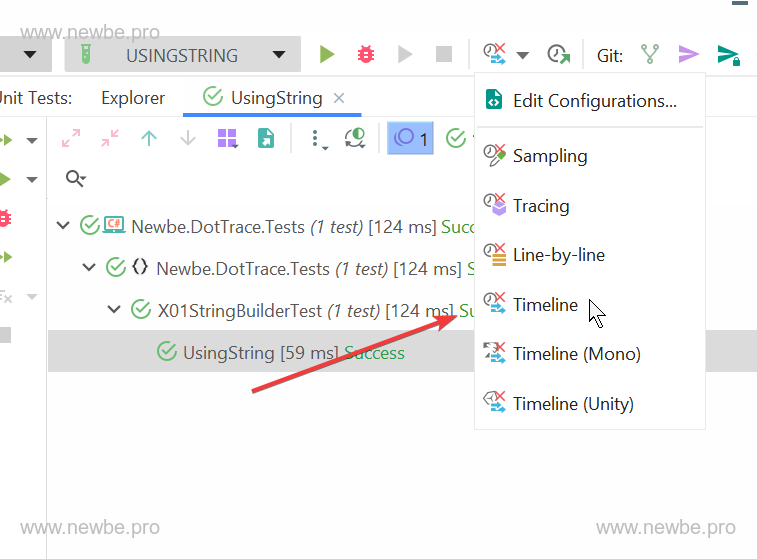
TimeLine is one of several patterns that provide a more comprehensive view of how each thread works, including multidivided data such as memory allocation, IO processing, locking, reflection, and so on.This will serve as one of the main patterns used in this example.
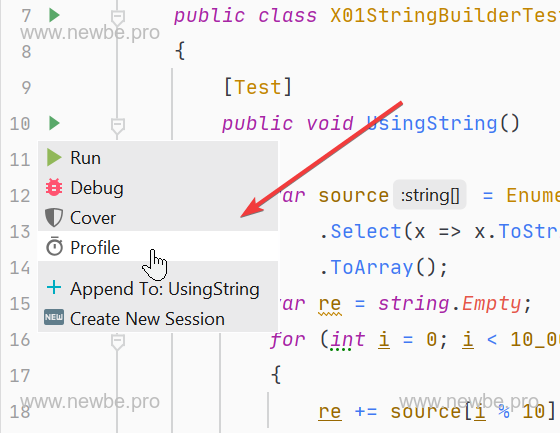
Next, as shown in the following image, start the profile for the corresponding test with a small icon on the left side of the unit test.
After you start profile, wait a while for the latest generated timeline report to appear.The location of the view report is shown below:
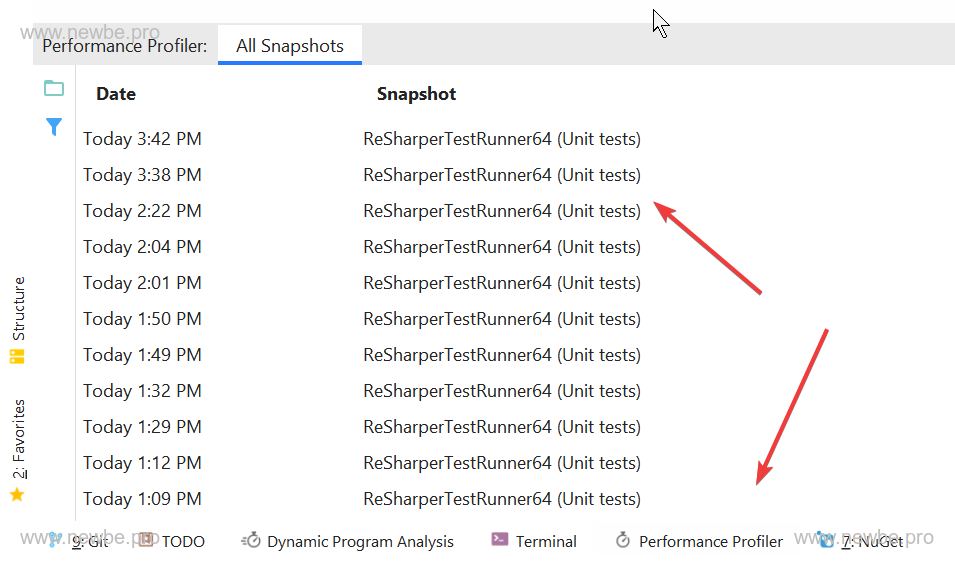
Right-click the corresponding report and select Open in External Viewer to open the generated report using dotTrace.
So first, let me open the first report and look at the report generated by the UsingString method.
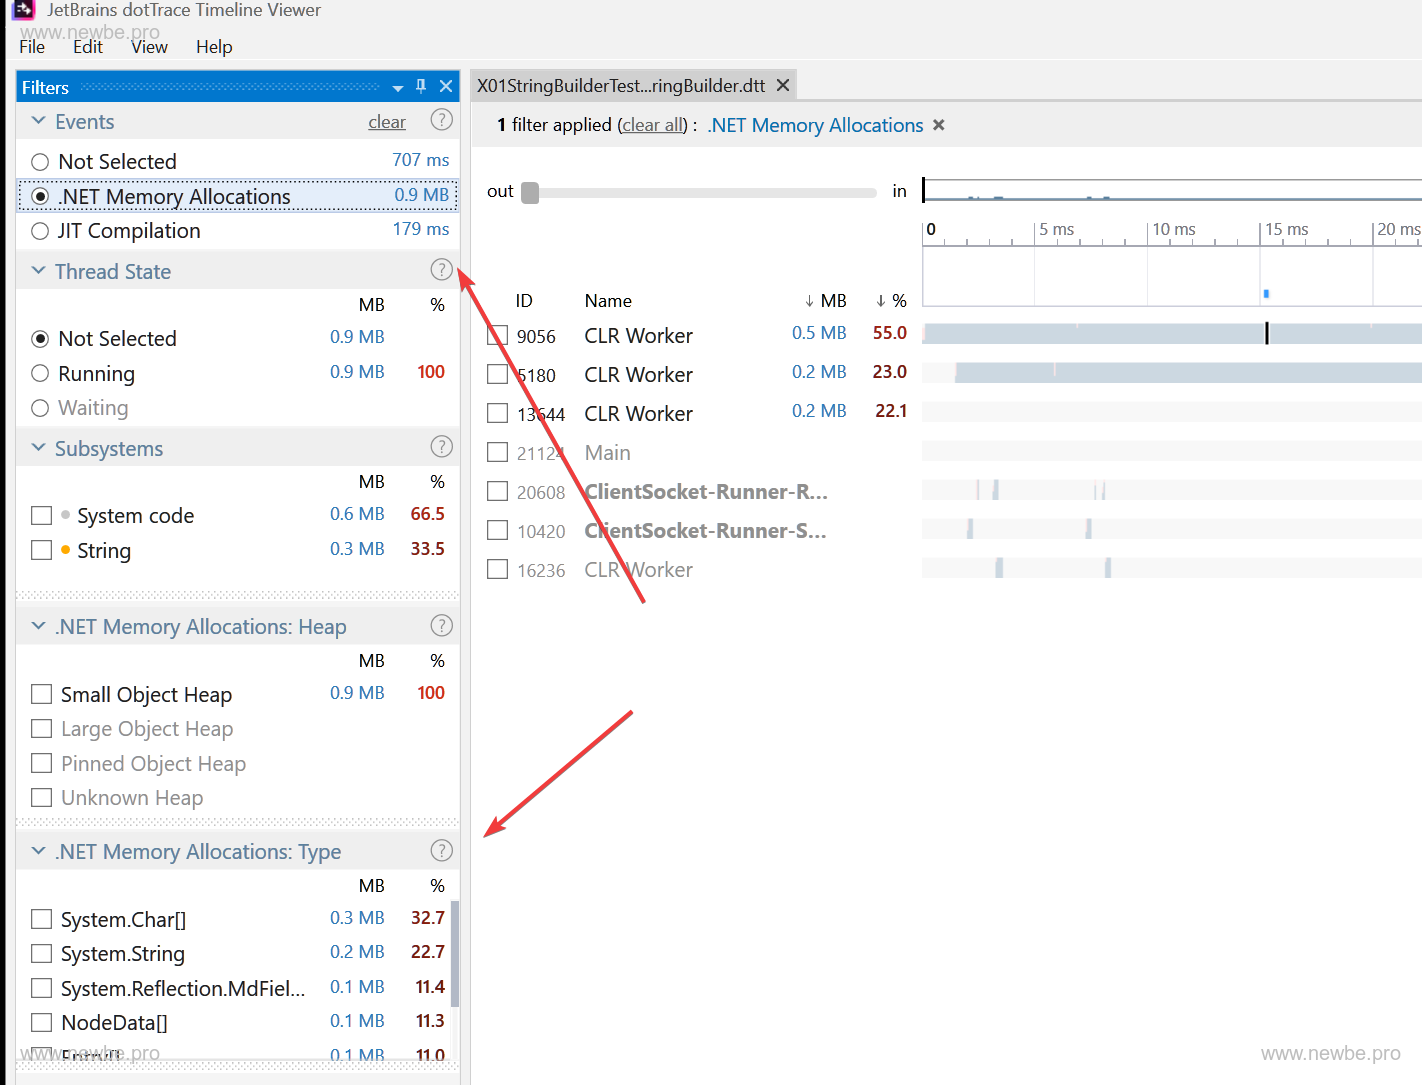
As shown in the following image, select .Net Memory Allocations to see the amount of memory allocated during the test run.
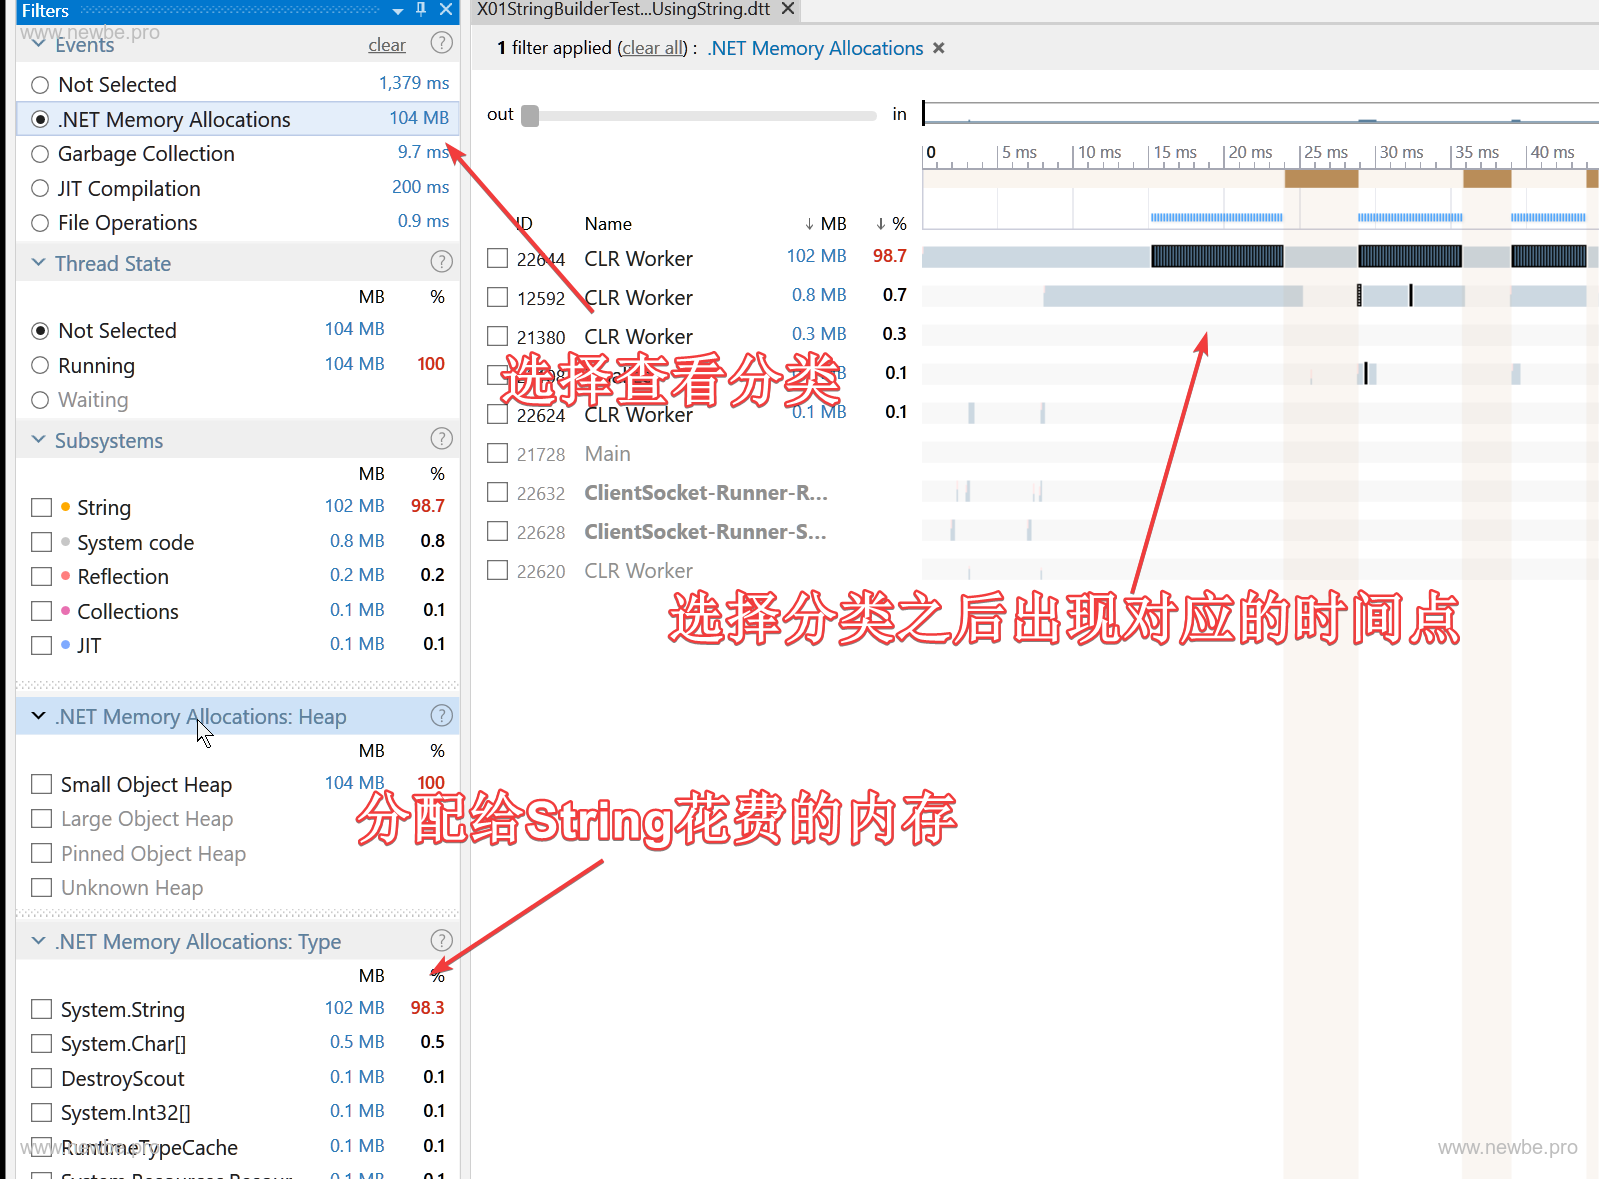
Based on the figure above, we can draw the following conclusions:
- In this test, 102M of memory was allocated to String.Note that the allocation shown in dotTrace refers to all allocated memory throughout the run.This value does not decrease even if it is subsequently recycled.
- Memory is allocated as long as it is made on the CLR Worker thread.And very dense.
Tip: Timeline shows longer running times than normal testing because of the additional consumption of data that needs to be recorded during the profile process.
So we came to the first conclusion:using string for direct stitching does consume more memory allocation.
Next, let's go ahead and look at the report on the UsingStringBuilder method, as shown:
Based on the figure above, we can draw the second conclusion:Using StringBuilder can significantly reduce the memory consumed compared to string direct stitching.
Of course, the final conclusion we came to:that the interviewer was not fooling people.
What effect class and struct have on memory
There are many differences between class and struct, and interview questions are frequent visitors.There is a difference in memory between the two.
So let's take a test to see the difference.
using System;
using System.Collections.Generic;
using NUnit.Framework;

namespace Newbe.DotTrace.Tests
{
    public class X02ClassAndStruct
    {
        [Test]
        public void UsingClass()
        {
            Console.WriteLine($"memory in bytes before execution: {GC. GetGCMemoryInfo(). TotalAvailableMemoryBytes}");
            const int count = 1_000_000;
            var list = new List<Student>(count);
            for (var i = 0; i < count; i++)
            {
                list. Add(new Student
                {
                    Level = int. MinValue
                });
            }

            list. Clear();

            var gcMemoryInfo = GC. GetGCMemoryInfo();
            Console.WriteLine($"heap size: {gcMemoryInfo.HeapSizeBytes}");
            Console.WriteLine($"memory in bytes end of execution: {gcMemoryInfo.TotalAvailableMemoryBytes}");
        }

        [Test]
        public void UsingStruct()
        {
            Console.WriteLine($"memory in bytes before execution: {GC. GetGCMemoryInfo(). TotalAvailableMemoryBytes}");
            const int count = 1_000_000;
            var list = new List<Yueluo>(count);
            for (var i = 0; i < count; i++)
            {
                list. Add(new Yueluo
                {
                    Level = int. MinValue
                });
            }

            list. Clear();

            var gcMemoryInfo = GC. GetGCMemoryInfo();
            Console.WriteLine($"heap size: {gcMemoryInfo.HeapSizeBytes}");
            Console.WriteLine($"memory in bytes end of execution: {gcMemoryInfo.TotalAvailableMemoryBytes}");
        }

        public class Student
        {
            public int Level { get; set; }
        }

        public struct Yueluo
        {
            public int Level { get; set; }
        }
    }
}
Code Essentials:
- Two tests, create 1,000,000 classes and struct to join to the List.
- After you run the test, output the size of the current heap space at the end of the test.
Following the basic steps provided in the last section, we compare the reports generated by the two methods.
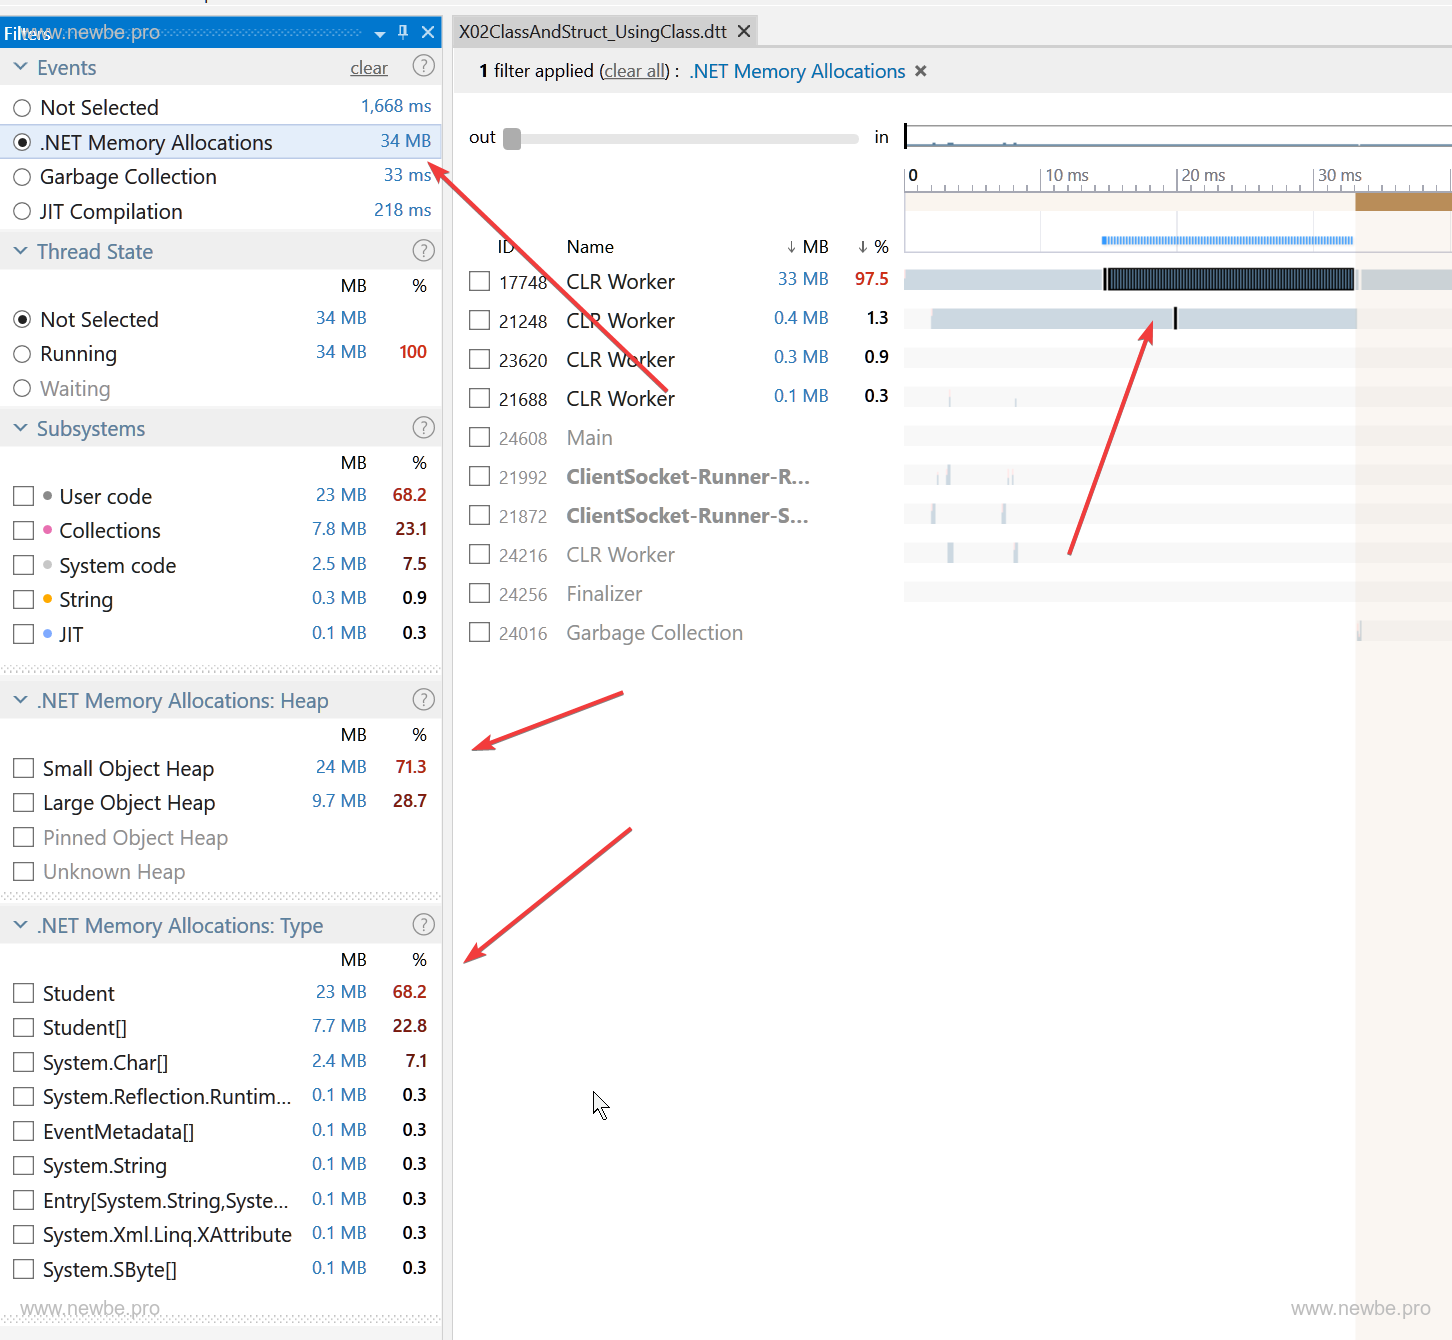
UsingClass
UsingStruct
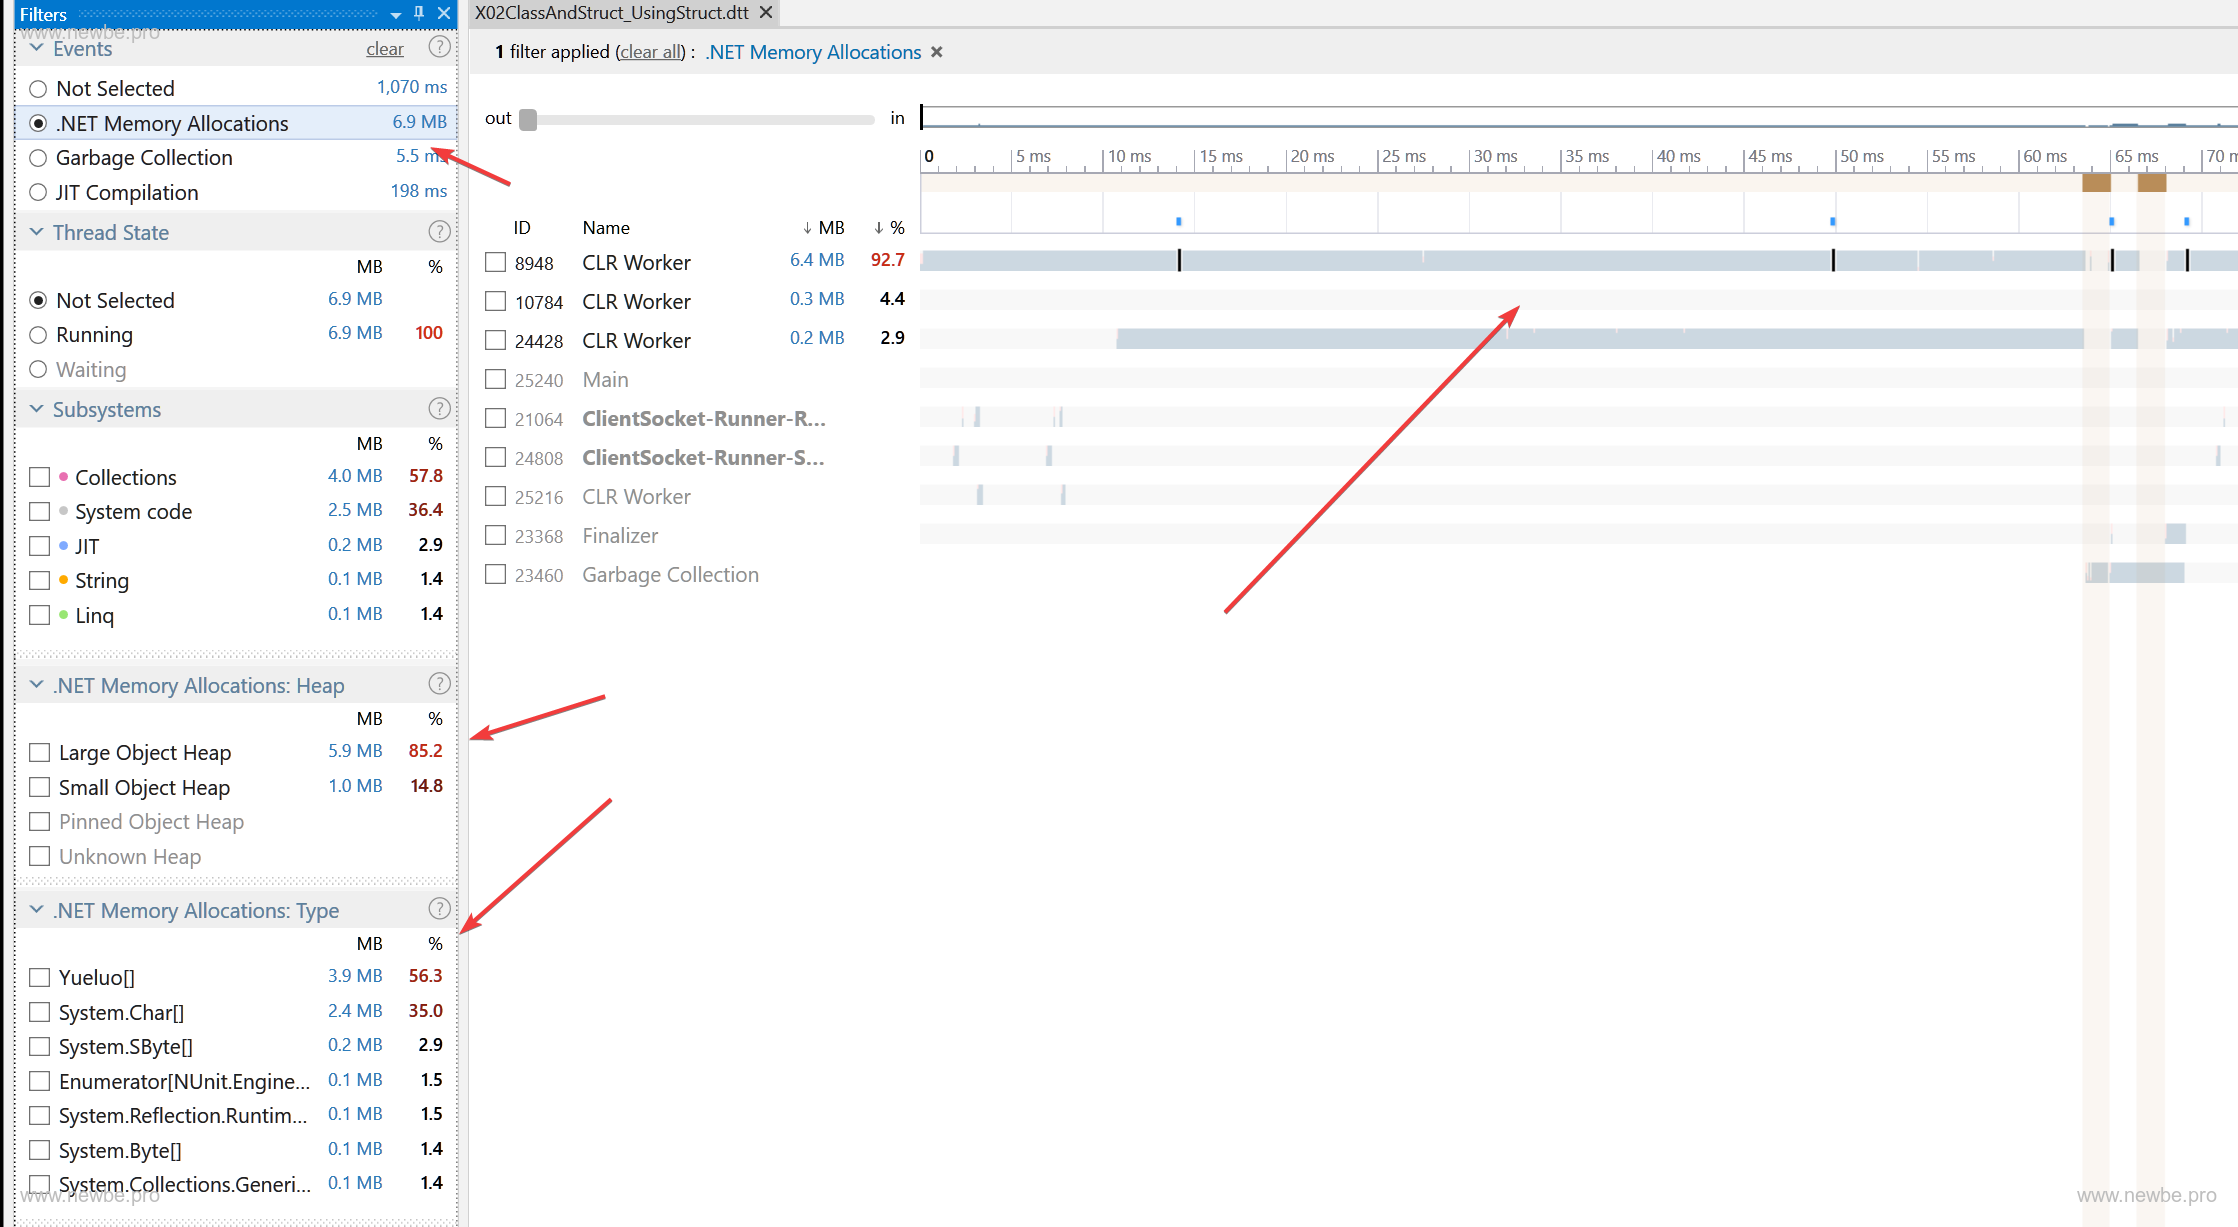
Comparing the two reports, you can draw the following conclusions:
- The memory allocation in the Timeline report contains only the memory that is allocated to the heap.
- Struct does not need to be assigned to the heap, however, the array is a reference object and needs to be assigned to the heap.
- The essence of List's self-increasing process is that the characteristics of the expansion array are also reflected in the report.
- In addition, it is not shown on the report, and as can be seen in the test printed text, the heap size after the UsingStruct run confirms that the struct will not be assigned to the heap.
Boxing and unboxing
Classic interview question X3, come on, code, report on!
using NUnit.Framework;

namespace Newbe.DotTrace.Tests
{
    public class X03Boxing
    {
        [Test]
        public void Boxing()
        {
            for (int i = 0; i < 1_000_000; i++)
            {
                UseObject(i);
            }
        }

        [Test]
        public void NoBoxing()
        {
            for (int i = 0; i < 1_000_000; i++)
            {
                UseInt(i);
            }
        }

        public static void UseInt(int age)
        {
            // nothing
        }

        public static void UseObject(object obj)
        {
            // nothing
        }
    }
}
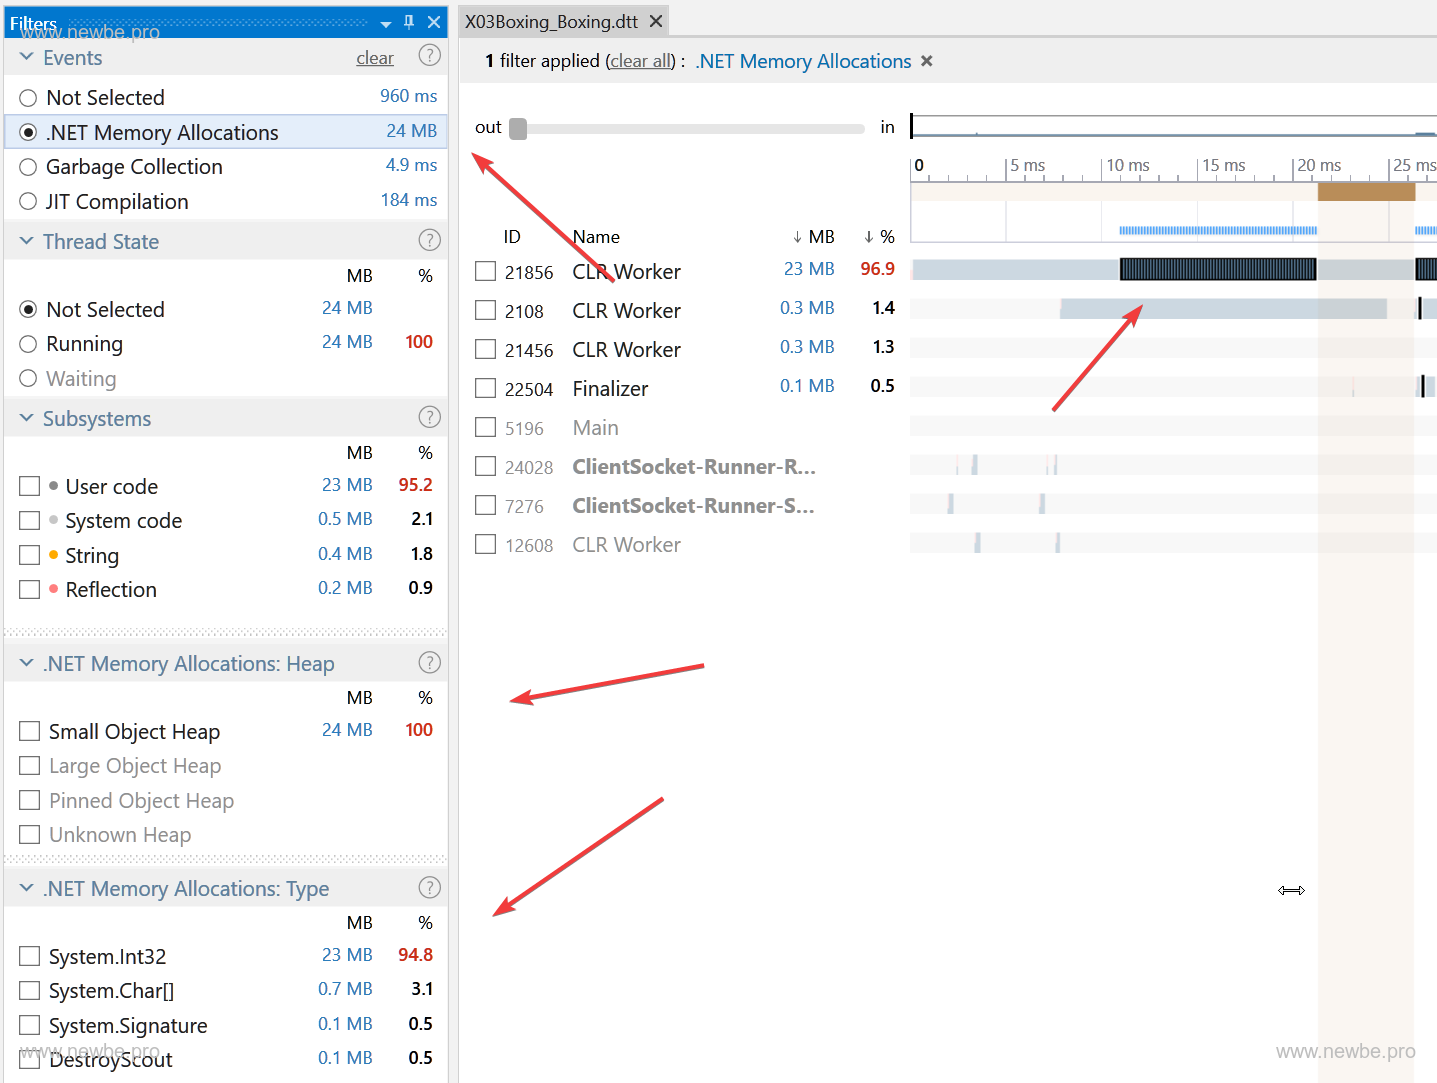
Boxing, boxing occurs
NoBoxing, no boxing
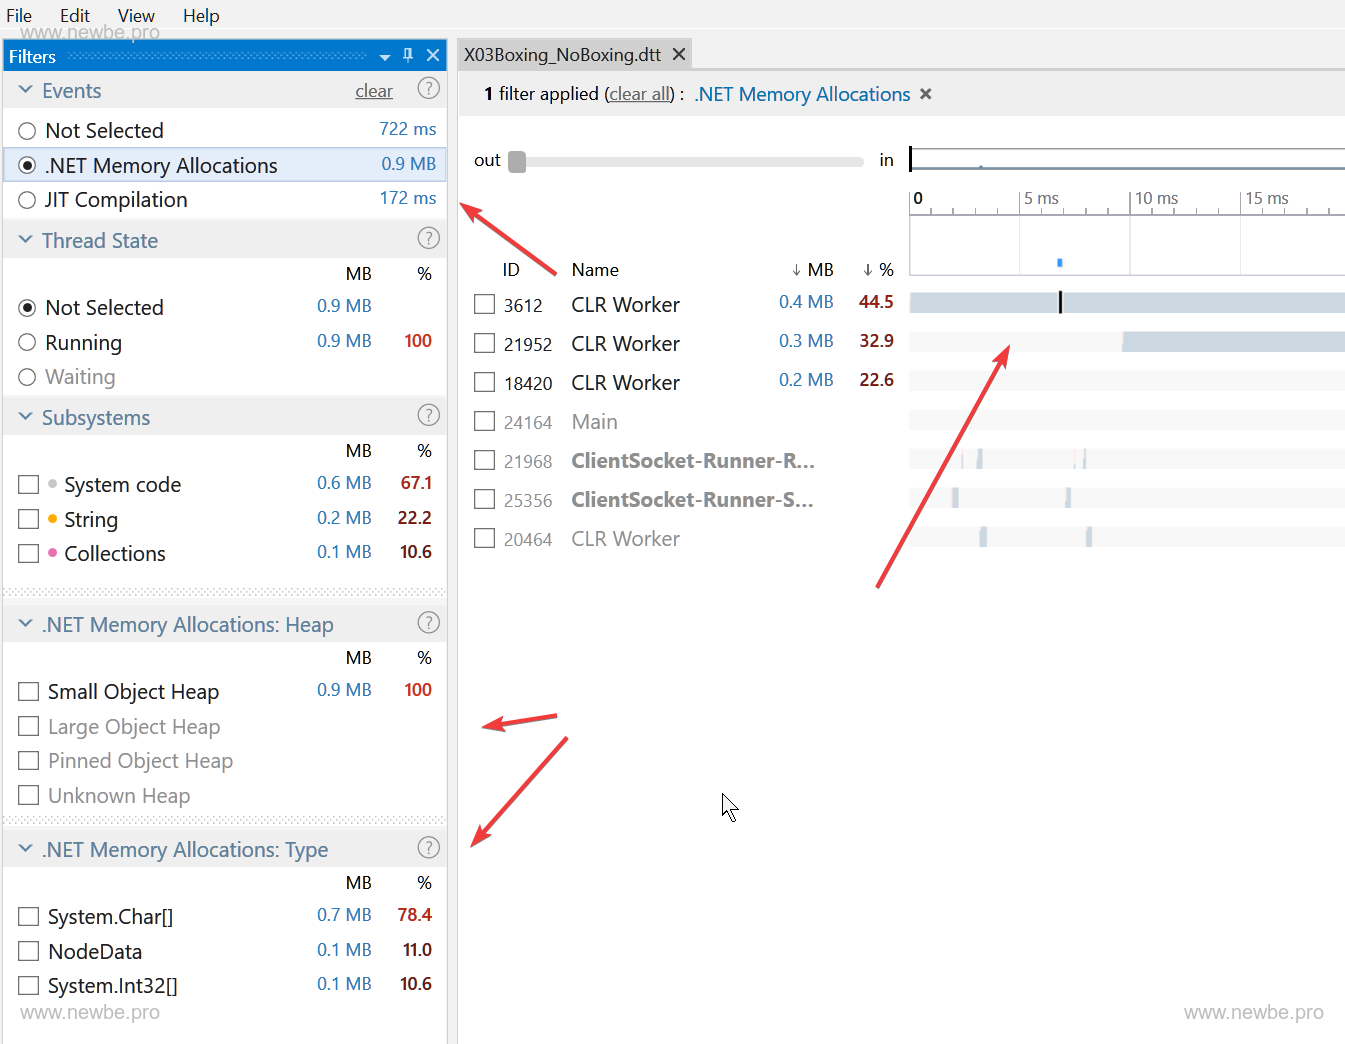
Comparing the two reports, you can draw the following conclusions:
- There is no killing without buying and selling, and there is no distribution of consumption without demolition.
What's the difference between Thread.Sleep and Task.Delay?
Classic interview question X4, come on, on the code, on the report!
using System;
using System.Collections.Generic;
using System.Threading;
using System.Threading.Tasks;
using NUnit.Framework;

namespace Newbe.DotTrace.Tests
{
    public class X04SleepTest
    {
        [Test]
        public Task TaskDelay()
        {
            return Task.Delay(TimeSpan.FromSeconds(3));
        }

        [Test]
        public Task ThreadSleep()
        {
            return Task.Run(() => { Thread.Sleep(TimeSpan.FromSeconds(3)); });
        }
    }
}
ThreadSleep

TaskDelay
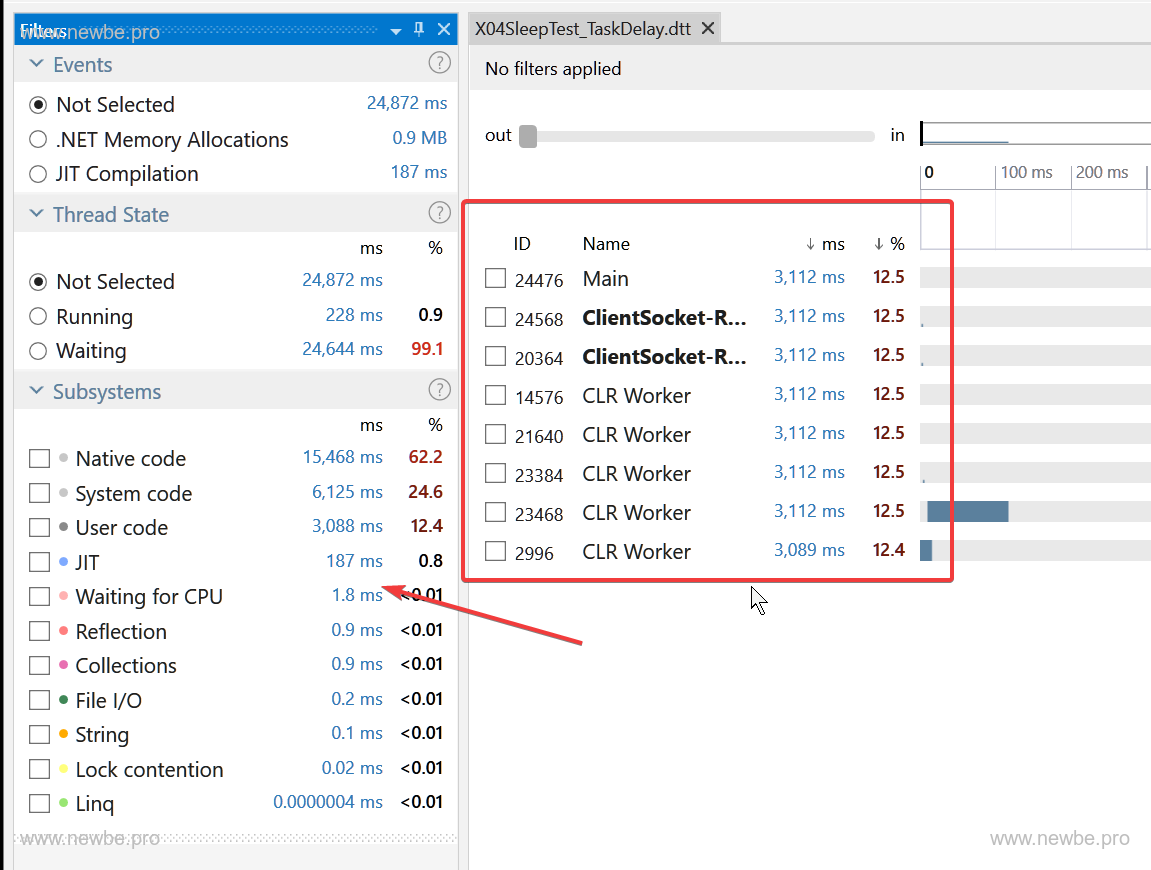
Comparing the two reports, you can draw the following conclusions:
- Thread.Sleep is tagged separately in dotTrace because it is a non-performing practice that can easily cause thread hunger.
- Thread.Sleep has one more thread in sleep than Task.Delay
Does blocking a large number of Tasks really cause your app to stay motionless?
With the conclusion of the next step, the author came up with a bold idea.We all know that threads are limited, so what if you start a lot of Thread.Sleep or Task.Delay?
Come on, code:
using System;
using System.Collections.Generic;
using System.Threading;
using System.Threading.Tasks;
using NUnit.Framework;

namespace Newbe.DotTrace.Tests
{
    public class X04SleepTest
    {

        [Test]
        public Task RunThreadSleep()
        {
            return Task.WhenAny(GetTasks(50));

            IEnumerable<Task> GetTasks(int count)
            {
                for (int i = 0; i < count; i++)
                {
                    var i1 = i;
                    yield return Task.Run(() =>
                    {
                        Console.WriteLine($"Task {i1}");
                        Thread.Sleep(int. MaxValue);
                    });
                }

                yield return Task.Run(() => { Console.WriteLine("yueluo is the only one dalao"); });
            }
        }

        [Test]
        public Task RunTaskDelay()
        {
            return Task.WhenAny(GetTasks(50));

            IEnumerable<Task> GetTasks(int count)
            {
                for (int i = 0; i < count; i++)
                {
                    var i1 = i;
                    yield return Task.Run(() =>
                    {
                        Console.WriteLine($"Task {i1}");
                        return Task.Delay(TimeSpan.FromSeconds(int. MaxValue));
                    });
                }

                yield return Task.Run(() => { Console.WriteLine("yueluo is the only one dalao"); });
            }
        }
    }
}
Here is no post report, readers can try this test, you can also write the content of the report in the comments of this article to participate in the discussion
Reflection calls and expression tree compilation calls
Sometimes we need to call a method dynamically.The most well-known way is to use reflection.
However, this is also a relatively time-consuming way to be known.
Here, the author provides an idea of using expression tree creation delegates instead of reflection to improve efficiency.
So, has there been a reduction in time consumption?Good report, I can talk myself.
using System;
using System.Diagnostics;
using System.Linq.Expressions;
using NUnit.Framework;

namespace Newbe.DotTrace.Tests
{
    public class X05ReflectionTest
    {
        [Test]
        public void RunReflection()
        {
            var methodInfo = GetType(). GetMethod(nameof(MoYue));
            Debug.Assert(methodInfo != null, nameof(methodInfo) + " != null");
            for (int i = 0; i < 1_000_000; i++)
            {
                methodInfo.Invoke(null, null);
            }

            Console.WriteLine(_count);
        }

        [Test]
        public void RunExpression()
        {
            var methodInfo = GetType(). GetMethod(nameof(MoYue));
            Debug.Assert(methodInfo != null, nameof(methodInfo) + " != null");
            var methodCallExpression = Expression.Call(methodInfo);
            var lambdaExpression = Expression.Lambda<Action>(methodCallExpression);
            var func = lambdaExpression.Compile();
            for (int i = 0; i < 1_000_000; i++)
            {
                func. Invoke();
            }

            Console.WriteLine(_count);
        }

        private static int _count = 0;

        public static void MoYue()
        {
            _count++;
        }
    }
}
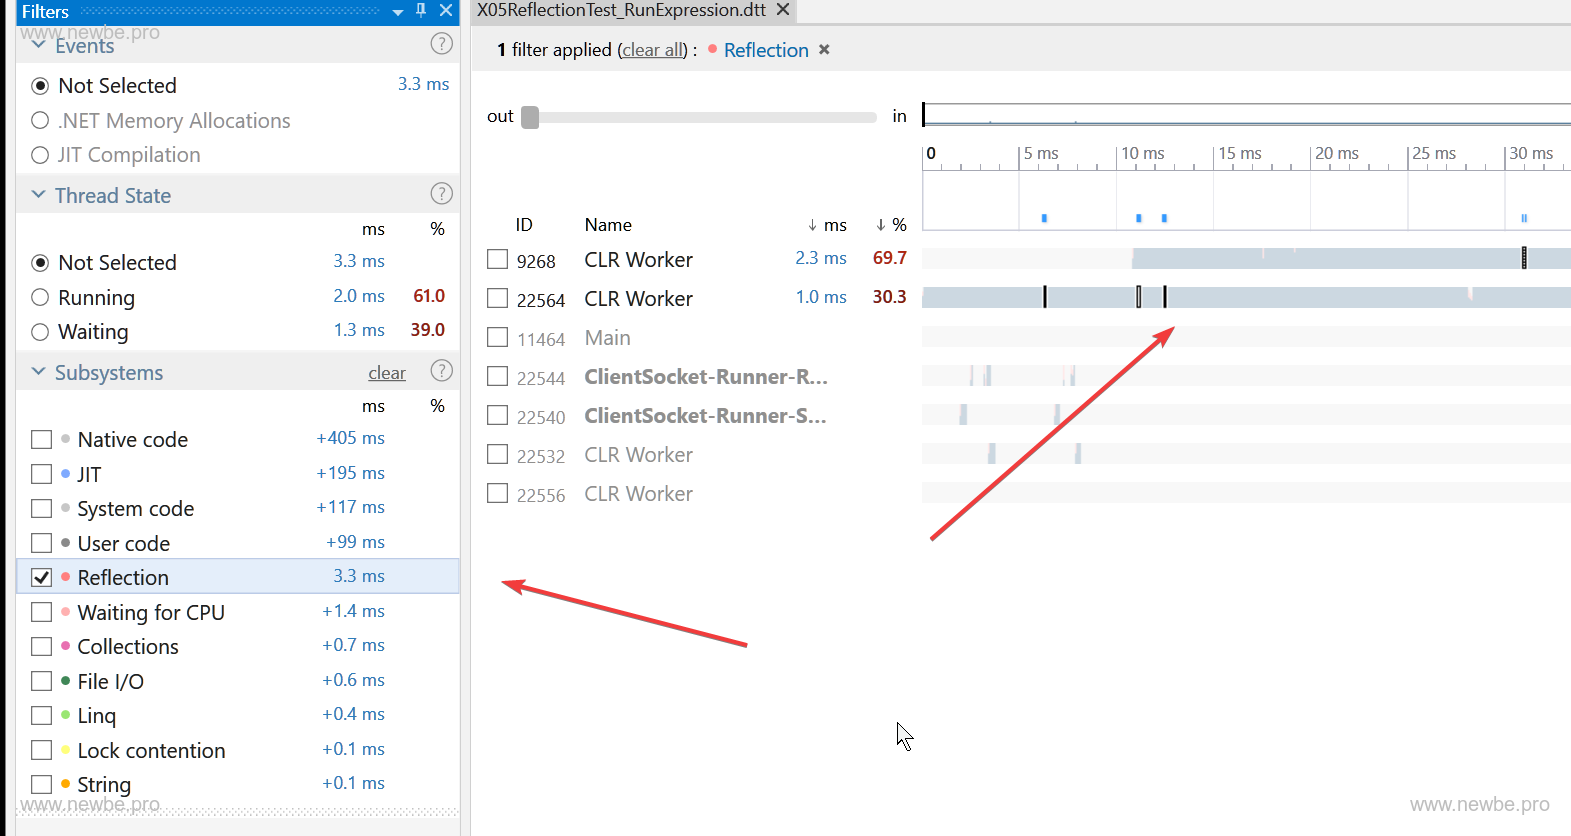
RunReflection, call directly using reflection.
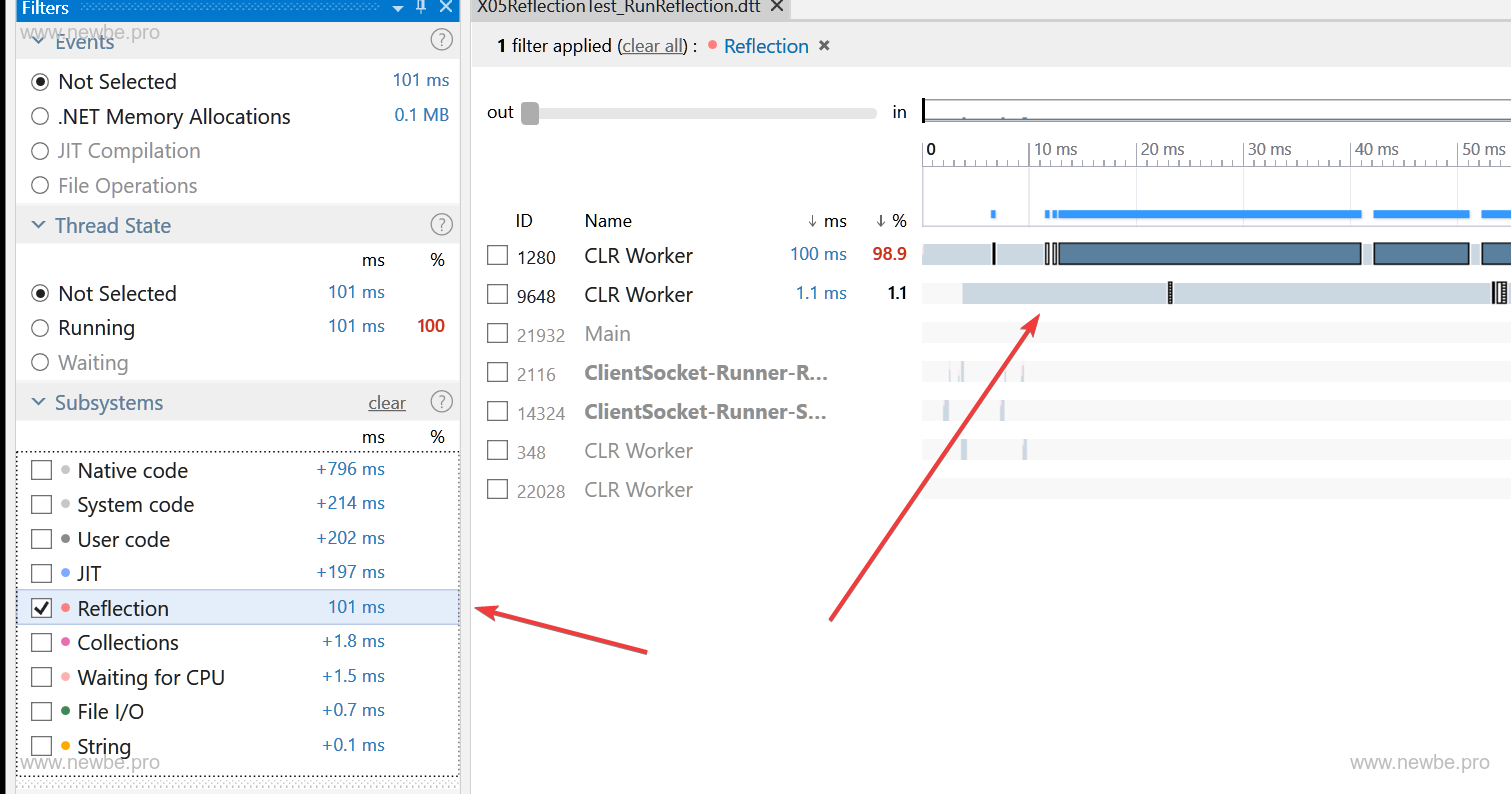
RunExpression, which compiles a delegate using an expression tree.
Summary
Use dotTrace to see how much memory and time the method consumes.The content presented in this article is only a small part of it.Developers can try to get started, which can be beneficial.
The sample code in this article can be found in the link repository below: