The Newbe.Claptrap project is a service-side development framework that the author is building on the theoretical basis ofreactive,Actor mode, andevent traceability.In this article, we'll look at the framework's ability to scale horizontally.
A previous informational synth
After a long time, we meet again today.First of all, I would like to introduce the past project:
For first-time readers of this framework, you can read the basic theory and how it works here.
Recently, we have also written some warm-up articles and tools, readers can learn about the:
- Talk about the application of reactive programming on the service side, database operation optimization, from 20 seconds to 0.5 seconds
- Newbe.Claptrap Project Weekly 1 - No wheels yet, run with wheels first
Today's topic
Today, let's do a lab preview to validate the Newbe.Claptrap framework and how to adapt to the growing number of online users in the form of horizontal extensions.
Description of business requirements
Let's first look at the business scenario to be implemented today:
- The user logs on via the API and generates a JWT token
- The validity of JWT token is verified when the user calls the API
- JWT token issuance is not performed using the regular JWS public and private key, but is hashed for each user using secret separately
- Verify to see how much memory different online users need to consume
- It must take no more than 200 ms for the user to log on to the build token
- Tokn's validation time must not exceed 10 ms
Bragging first hits the draft
The author did not search for the "number of online users" directly related to the theoretical definition, therefore, in order to avoid differences in your understanding.The author first according to their own understanding to point out:number of online users in the end means what kind of technical requirements?
Non-online users who are online should not be affected by the number of users who are already online
If a user logs on, it takes 100 ms.So whether the number of users online today is ten or a million.This login does not take significantly longer than 100 ms.
Of course, limited physical hardware is sure to slow down or even make it easier or even wrong for new users to log on when the number of online users exceeds a threshold, such as two million.
However, by increasing the physical machine, this threshold can be raised, and we can consider the horizontal expansion design to be successful.
For any online user, the system performance feedback should be the same
For example, users who are already online need to consume 100 ms to query their order details.Then the average consumption of order queries by any one user should be stable at 100 ms.
Of course, you need to rule out high-concentration performance issues like snapping up.The main discussion here is the daily steady increase in capacity.(We'll talk about "snapping" separately later)
The specific point can be understood in this way.Let's say we're doing a cloud note product.
So if adding physical machines increases the number of users who use cloud note products at the same time, without sacrificing the performance experience of any one user, we think horizontal scaling design is a success.
In this experiment, if the user is already logged in, the time to verify the validity of the JWT is approximately 0.5 ms.
Call the timing relationship

Brief description:
- Client login requests are communicated layer by layer to UserGrain
- UserGrain will internally activate a Claptrap to maintain the state data in UserGrain.Includes username, password, and Secret for JWT signature.
- Subsequent build JWT builds and validations will use the data in UserGrain directly.Because the data in UserGrain is "cached" in memory for a period of time.So the JWT build and validation that follows will be very fast.The measured amount is approximately 0.5 ms.
Physical structure design
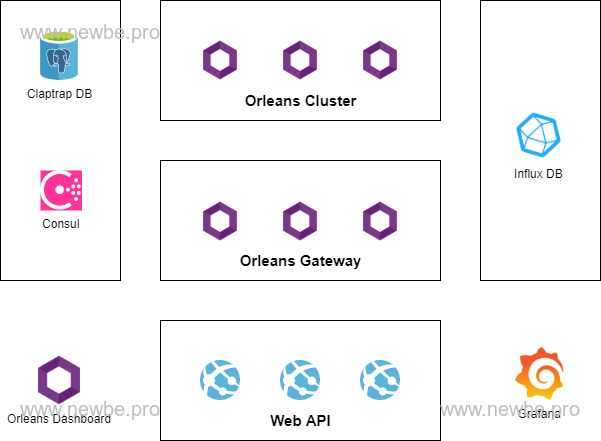
As shown in the figure above, this is the physical component of the test:
| Name | Description |
|---|---|
| WebAPI | Expose to the outside call the WebAPI interface.Provides an interface for logging in and verifying token. |
| Orleans Cluster | The core process of hosting Grain. |
| Orleans Gateway | The Orleans Cluster is essentially the same, but the WebAPI can only communicate with Gateway |
| Orleans Dashboard | The Orleans Gateway is basically the same, but a dashboard presentation has been added to see the entire Orleans cluster |
| Consul | Cluster discovery and maintenance for Orleans clusters |
| Claptrap DB | Used to hold event and status data for the Newbe.Claptrap framework |
| Influx DB & Grafana | Used to monitor Performance Metrics data related to Newbe.Claptrap |
The number of Orleans cluster nodes in this experiment is actually the total number of Cluster plus Gateway plus Dashboard.The above divisions are actually distinguished by differences in function settings.
The physical nodes that test the Horizontal Extension feature are primarily The Orleans Cluster and The Orleans Gateway.Memory usage for the following conditions will be tested separately.
| Orleans Dashboard | Orleans Gateway | Orleans Cluster |
|---|---|---|
| 1 | 0 | 0 |
| 1 | 1 | 1 |
| 1 | 3 | 5 |
This experiment uses deployment testing by Windows Docker Desktop in conjunction with WSL 2.
The above physical structures are actually designed according to the most complex circumstances of the experiment.In fact, if the business scenario is simple enough, the physical structure can be cropped.You can see the instructions in the FAQ below for more details.
The actual test data
Below, test different cluster sizes and user numbers
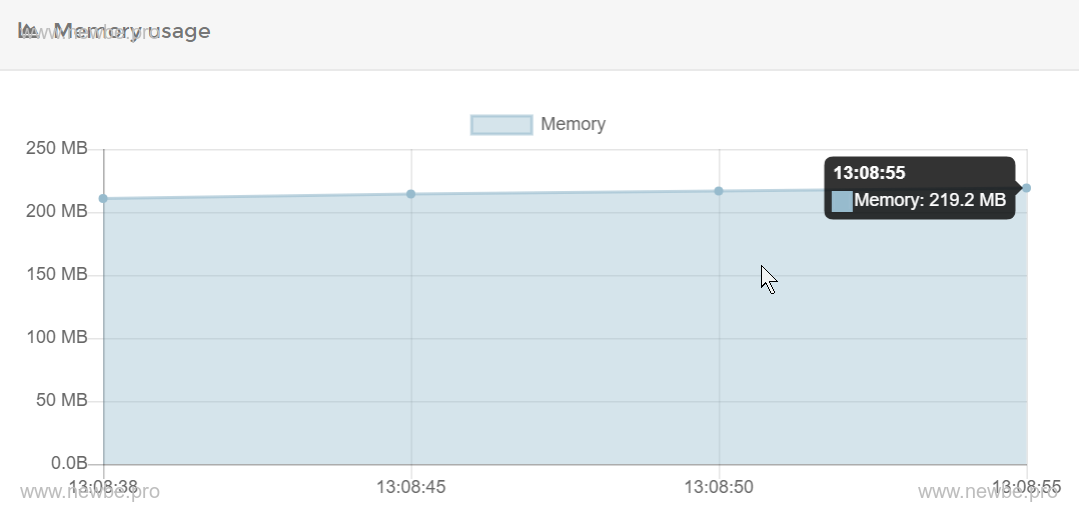
0 Gateway 0 Cluster
By default, when you first start the Dashboard node, portainer allows you to see that the container consumes about 200 MB of memory, as shown in the:
The test console makes 30,000 requests to the WebAPI.Each batch of 100 requests is sent in batches.
After a wait of about two minutes, look again at the memory, about 9.2 GB, as shown in the:
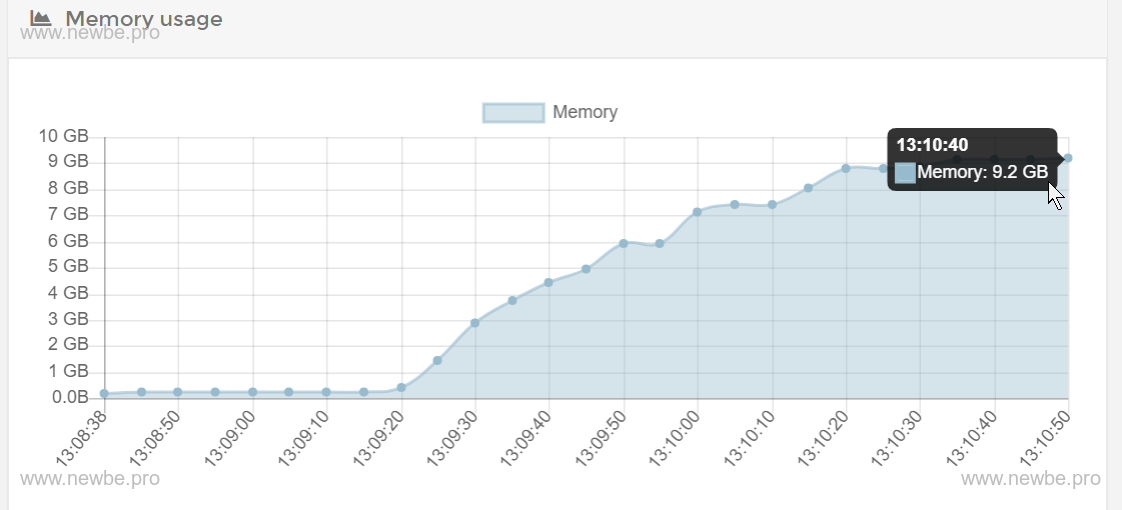
Therefore, we simply estimate the amount of memory that each online user needs to consume is approximately (9.2 x 1024-200)/30000 x 0.3 MB.
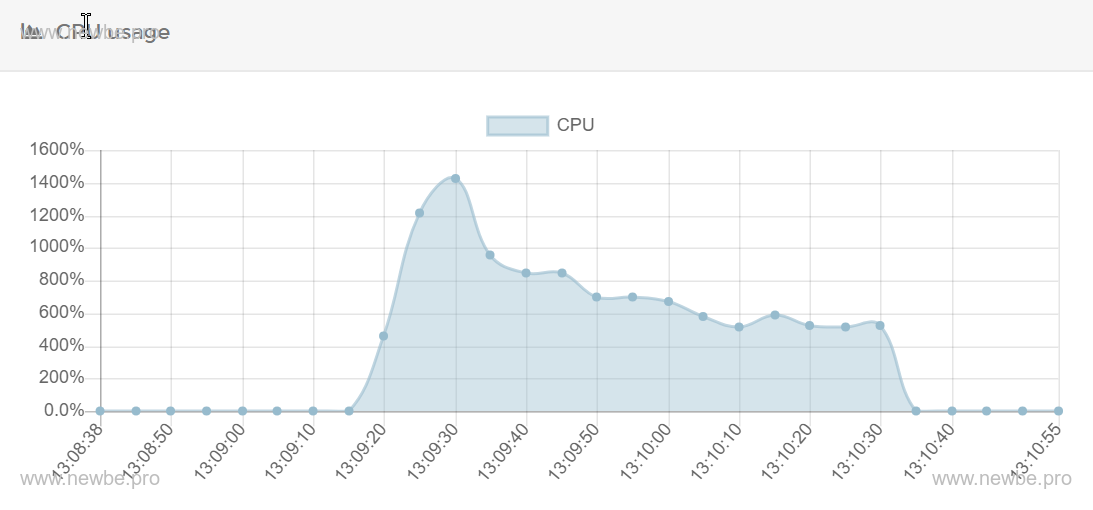
In addition, you can view some secondary data:
CPU usage
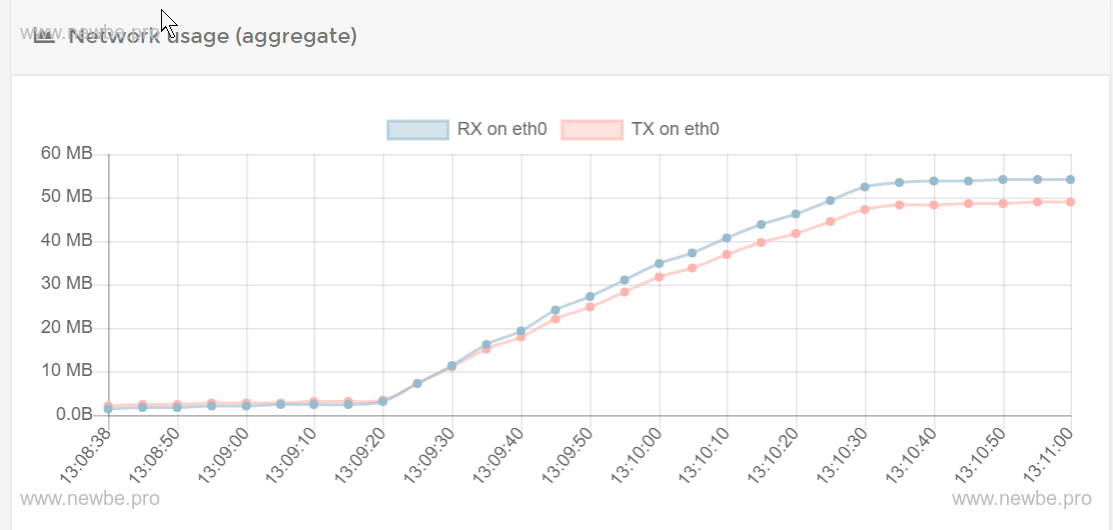
Network throughput
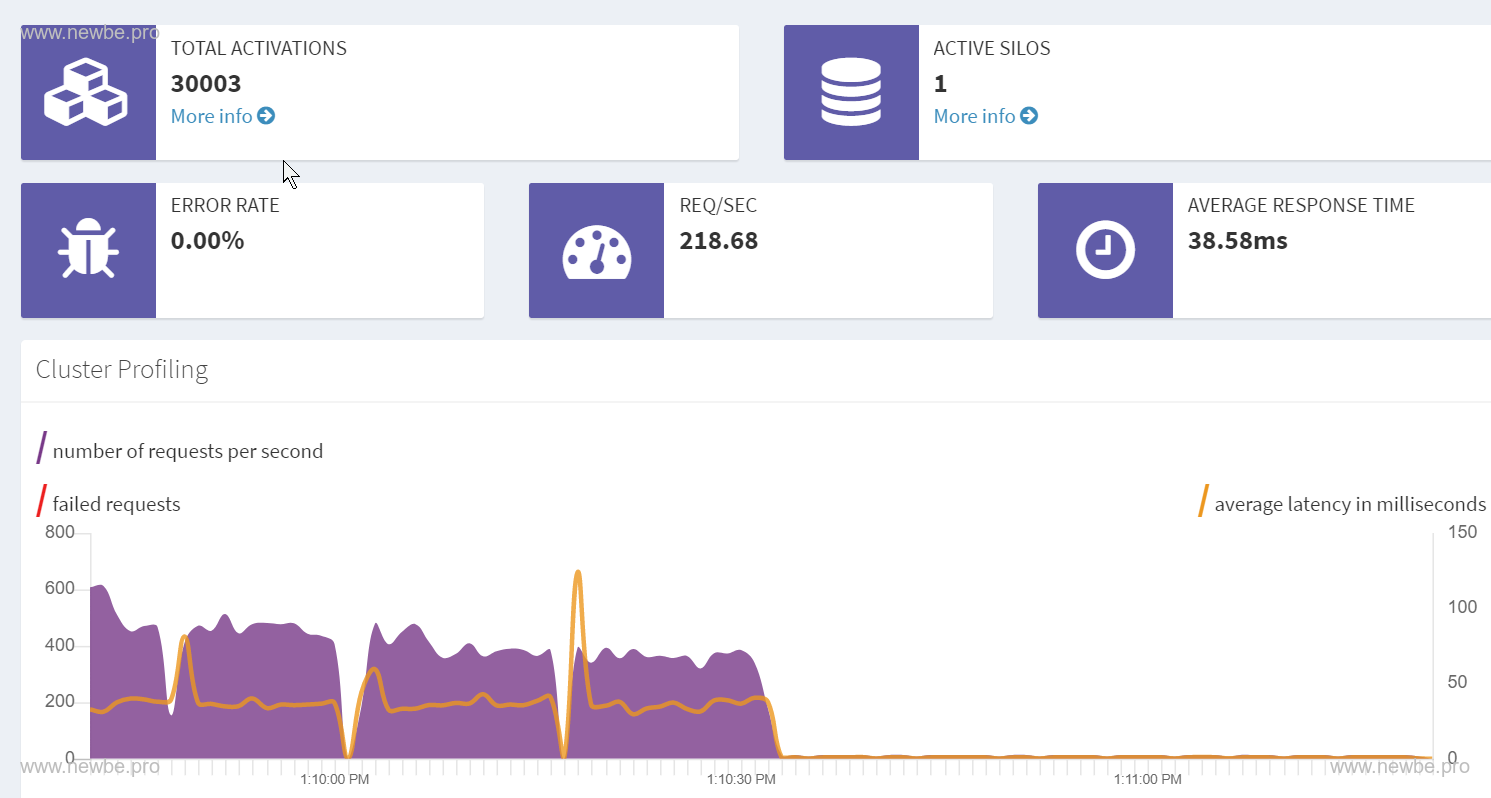
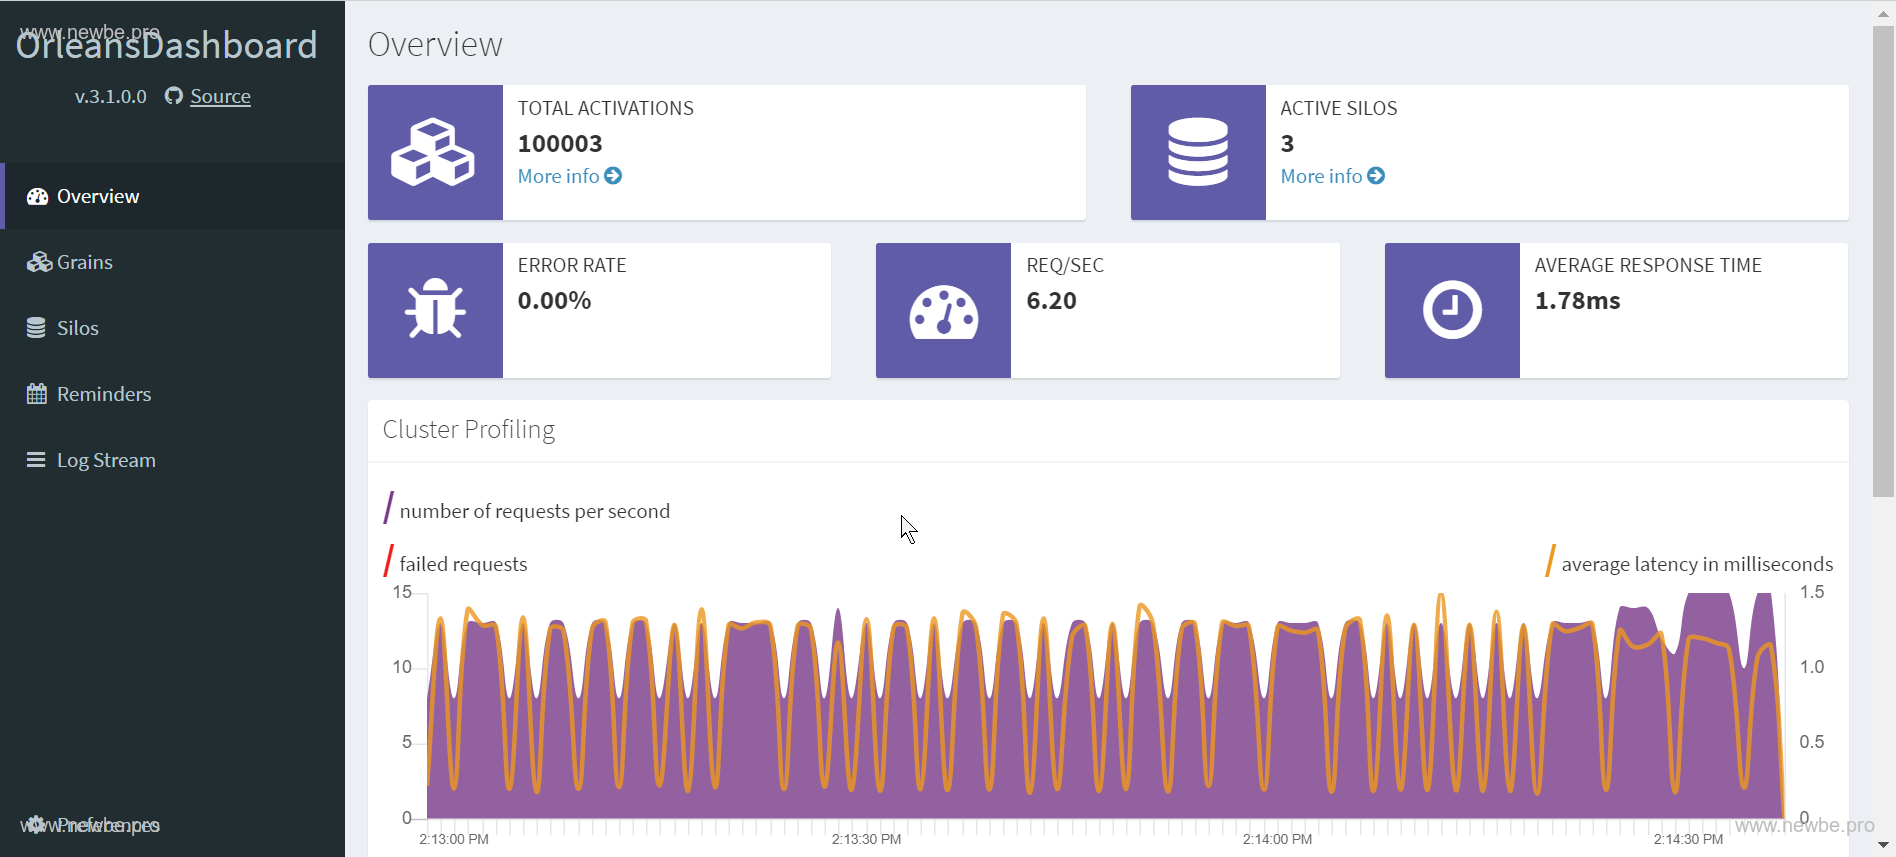
Orleans Dashboard.The 30,000 in TOTAL ACTIVATIONS in the upper left corner represents the number of UserGrains currently in memory, and the other three are Grains used by Dashboard.
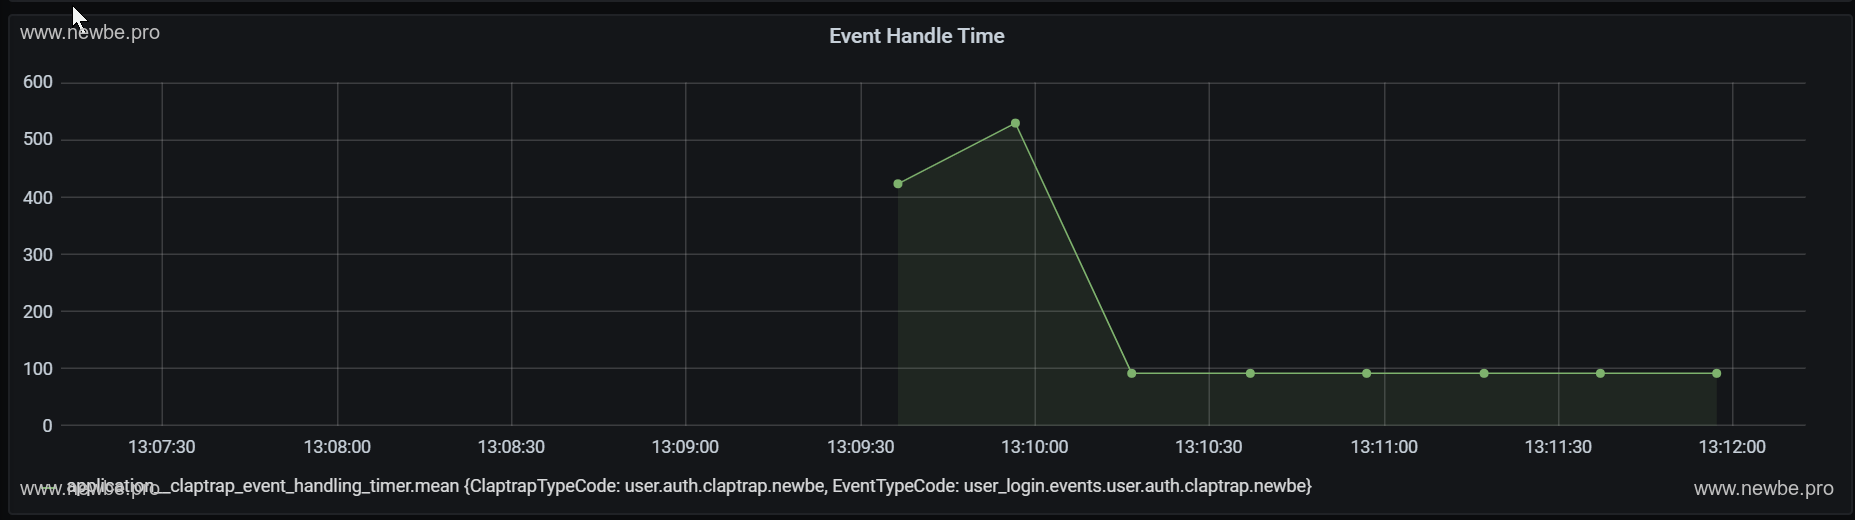
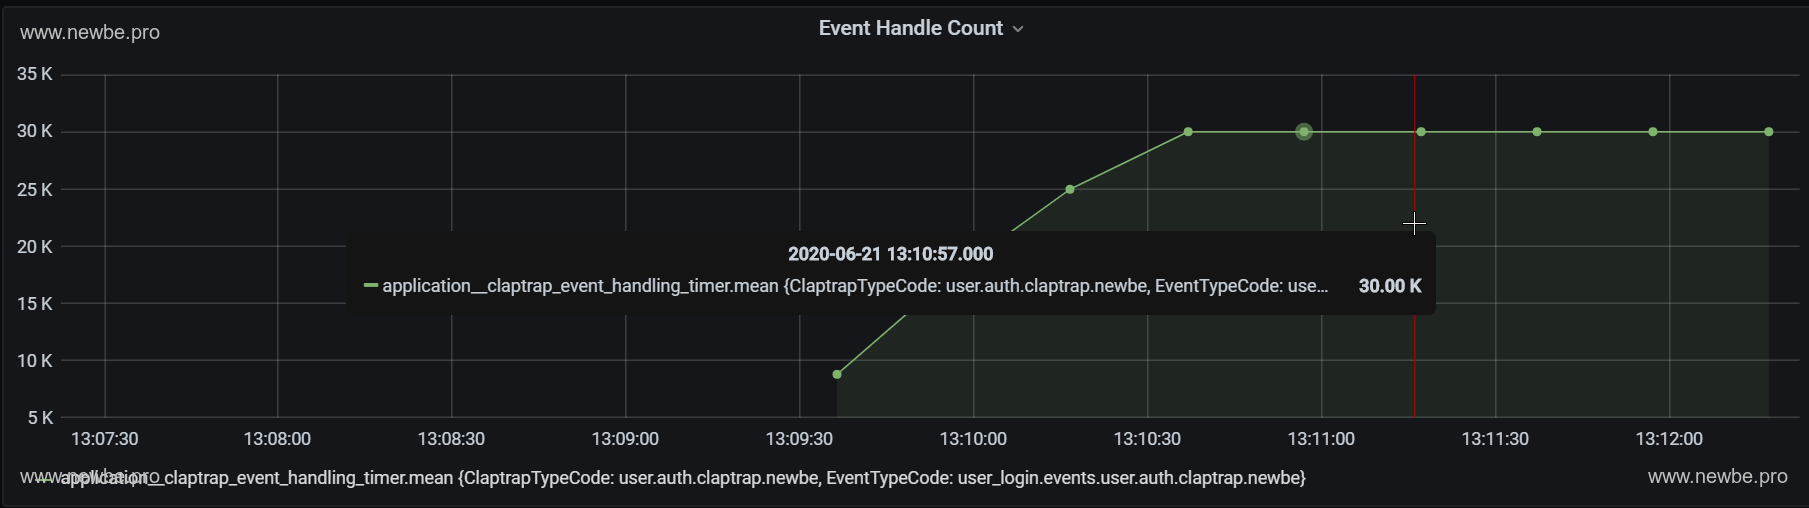
The average processing time for events viewing Newbe.Claptrap in Grafana is approximately 100-600 ms.This test is primarily a memory condition, with a processing time of 30s, so the sample size is small.We'll test it in more detail in a later article about the processing time.
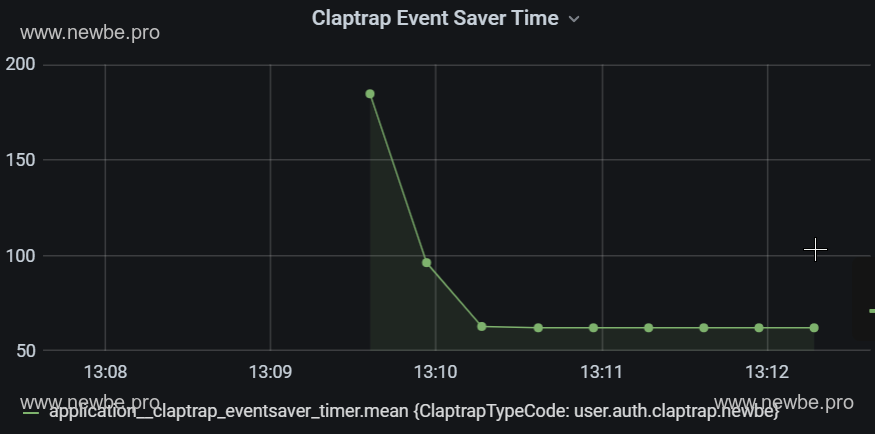
The average time it takes to save events in Grafana to view Newbe.Claptrap is about 50-200 ms.The length of time an event is saved is a major part of event processing.
The total number of events handled in Grafana to view Newbe.Claptrap.One is logged in 30,000 times, so the total number of events is 30,000.
1 Gateway 1 Cluster
Next, we test for two additional nodes.
Again, the number of Orleans cluster nodes is actually the total number of Cluster plus Gateway plus Dashboard.Therefore, compared to the last test, the number of nodes in the test is 3.
The memory usage tested is as follows:
| The number of users | The average memory of the node | Total memory consumption |
|---|---|---|
| 10000 | 1.8 GB | 1.8*3 = 5.4 GB |
| 20000 | 3.3 GB | 3.3*3 = 9.9 GB |
| 30000 | 4.9 GB | 4.9*3 = 14.7 GB |
So, in the case of 30,000 users, the average user consumes about (14.7 x 1024-200 x 3)/30000 x 0.48 MB
Why has the number of nodes increased and the average memory consumption has increased?The author speculates that there has been no validation:nodes have increased, and that communication between nodes actually requires additional memory, so on average it increases.
3 Gateway 5 Cluster
Let's add nodes again.The summary points are 1 (dashboard) and 3 (cluster) and 5 (gateway) and 9 nodes
The memory usage tested is as follows:
| The number of users | The average memory of the node | Total memory consumption |
|---|---|---|
| 20000 | 1.6 GB | 1.6*9 = 14.4 GB |
| 30000 | 2 GB | 2*9 = 18 GB |
So, in the case of 30,000 users, the average user consumes approximately (18 x 1024-200 x 9)/30000 x 0.55 MB
How much memory do 100,000 users need?
All of the above tests are in the number of 30,000 users, which is a special number.Because the number of users continues to increase, the memory will exceed the memory balance of the tester.(Please sponsor two 16G)
If you continue to increase the number of users, you will start using the operating system's virtual memory.Although it can run, it is less efficient.The original login may only need 100 ms.Users who use virtual memory need 2 s.
Therefore, in the case of slower speeds, it may not make much sense to verify how much memory is required.
However, this does not mean that you will not be able to continue to log on, as is the case with the case of 1-plus1, when all 100,000 users are logged in.(There are 100,000 users online at the same time, add some memory, not bad money.))
Source build instructions
The code for this test can be found in the sample code base at the end of the article.To make it easier for readers to experiment on their own, docker-compose is primarily used for construction and deployment.
So the only environmental requirement for a tester is to install Docker Desktop correctly.
You can get the latest sample code from any of the following addresses:
Get started quickly
Use the console the src/Newbe.Claptrap.Auth/LocalCluster folder.You can start all components locally by running the following commands:
docker-compose up -d
You need to pull some public images hosted on Dockerhub along the way, and make sure that the accelerators are configured correctly locally so that you can build quickly.can be set up by reading this document
After a successful launch,components can be through the docker ps website.
PS>docker ps
CONTAINER ID        IMAGE                                                                            COMMAND                  CREATED             STATUS              PORTS                                                                                                                              NAMES
66470e5393e2        registry.cn-hangzhou.aliyuncs.com/newbe36524/newbe-claptrap-auth-webapi          "dotnet Newbe.Claptr…"   4 hours ago         Up About an hour    0.0.0.0:10080->80/tcp                                                                                                              localcluster_webapi_1
3bbaf5538ab9        registry.cn-hangzhou.aliyuncs.com/newbe36524/newbe-claptrap-auth-backendserver   "dotnet Newbe.Claptr…"   4 hours ago         Up About an hour    80/tcp, 443/tcp, 0.0.0.0:19000->9000/tcp, 0.0.0.0:32785->11111/tcp, 0.0.0.0:32784->30000/tcp                                       localcluster_dashboard_1
3f60f51e4641        registry.cn-hangzhou.aliyuncs.com/newbe36524/newbe-claptrap-auth-backendserver   "dotnet Newbe.Claptr…"   4 hours ago         Up About an hour    80/tcp, 443/tcp, 9000/tcp, 0.0.0.0:32787->11111/tcp, 0.0.0.0:32786->30000/tcp                                                      localcluster_cluster_gateway_1
7d516ada2b26        registry.cn-hangzhou.aliyuncs.com/newbe36524/newbe-claptrap-auth-backendserver   "dotnet Newbe.Claptr…"   4 hours ago         Up About an hour    80/tcp, 443/tcp, 9000/tcp, 30000/tcp, 0.0.0.0:32788->11111/tcp                                                                     localcluster_cluster_core_1
fc89fcd973f9        grafana/grafana                                                                  "/run.sh"                4 hours ago         Up 6 seconds        0.0.0.0:23000->3000/tcp                                                                                                            localcluster_grafana_1
1f10ed0eb25f        postgres                                                                         "docker-entrypoint.s…"   4 hours ago         Up About an hour    0.0.0.0:32772->5432/tcp                                                                                                            localcluster_claptrap_db_1
d5d2bec74311        adminer                                                                          "entrypoint.sh docke…"   4 hours ago         Up About an hour    0.0.0.0:58080->8080/tcp                                                                                                            localcluster_adminer_1
4c4be69f2f41        bitnami/consul                                                                   "/opt/bitnami/script…"   4 hours ago         Up About an hour    8300-8301/tcp, 8500/tcp, 8301/udp, 8600/tcp, 8600/udp                                                                              localcluster_consulnode3_1
88811d3aa0d2        influxdb                                                                         "/entrypoint.sh infl…"   4 hours ago         Up 6 seconds        0.0.0.0:29086->8086/tcp                                                                                                            localcluster_influxdb_1
d31c73b62a47        bitnami/consul                                                                   "/opt/bitnami/script…"   4 hours ago         Up About an hour    8300-8301/tcp, 8500/tcp, 8301/udp, 8600/tcp, 8600/udp                                                                              localcluster_consulnode2_1
72d4273eba2c        bitnami/consul                                                                   "/opt/bitnami/script…"   4 hours ago         Up About an hour    0.0.0.0:8300-8301->8300-8301/tcp, 0.0.0.0:8500->8500/tcp, 0.0.0.0:8301->8301/udp, 0.0.0.0:8600->8600/tcp, 0.0.0.0:8600->8600/udp   localcluster_consulnode1_1
Once the startup is complete, you can view the relevant interface through the links below
| Address | Description |
|---|---|
| http://localhost:19000 | The Orleans Dashboard views the status of nodes in the Orleans cluster |
| http://localhost:10080 | Web API base address, this time using the API base address tested |
| http://localhost:23000 | Grafana address to view performance metrics related to Newbe.Claptrap |
Source build
Use the console the src/Newbe.Claptrap.Auth folder.By running the following commands, you can build the code locally:
./LocalCluster/pullimage.cmd
docker-compose build
After waiting for the build to complete, the relevant image is generated locally.Next, you can try to launch the app locally for the first time:
Use the console the src/Newbe.Claptrap.Auth/LocalCluster folder.You can start the container by running the following command:
docker-compose up -d
FAQ
Why aren't the code and configuration details described in the article?
This article is intended to show the reader the experimental feasibility of this scenario, and how to write code using the Newbe.Claptrap framework, which is not the main thrust of this article and is therefore not mentioned.
The other point, of course, is that the framework is not finalized, everything is likely to change, and the details of the code are of little significance.
However, it can be explained in advance that:writing is very simple, because the business requirements of this example are very simple, so the code content is not much.All can be found in the sample repository.
Storage Token with Redis can also implement the above requirements, why choose this framework?
At present, the author does not have a full reason to convince the reader must use which scheme, here is only to provide a feasible scheme, as to the actual should choose which scheme, should have the reader to consider, after all, whether the tool or need to try to know.
If it's up to 100 online users, how do I crop the system?
The only components required are Orleans Dashboard, WebAPI, and Claptrap Db.All other components are non-essential.And if you modify the code, Orleans Dashboard and WebAPI can be merged.
So the smallest is a process plus a database.
Why doesn't Grafana have a report?
Grafana needs to manually create DataSource and import Dashboard after its first launch.
The parameters related to this experiment are as follows:
DataSource
- URL: http://influxdb:8086
- Database: metricsdatabase
- User: claptrap
- Password: claptrap
Click here for the Dashboard definition file
What is the physical configuration of the tester?
There is no dedicated free memory and 16GB of memory was used before testing began.The following is the test machine's figure data (foreign garbage, about 3500 yuan):
Processor Intel Xeon (Xeon) E5-2678 v3 s 2.50GHz 12 core 24 threads motherboard HUANANZHI X99-AD3 GAMING (Wellsburg) graphics Nvidia GeForce GTX 750 Ti Ti ( 2 GB / Nvidia ) 32 GB of memory ( Samsung DDR3L 1600MHz ) 2013 Senior memory main hard drive Kingston SA400S37240G ( 240 GB / SSD )
If you have a better physical configuration, I believe you can get better data.
Even 0.3 MB per user is too high
The framework is still being optimized.The future will be better.